Wisconsin’s obesity map: the ZIP codes weigh In
Health researchers have compiled a searchable map of obesity in America’s Dairyland by ZIP code, and the picture is alarming.
Wisconsin is the first state with a detailed ZIP code-level obesity map based on electronic health record data, meaning it is based on height and weight measurements taken when people are at their doctors’ offices, rather than self-reported heights and weights, saidVincent Cryns, MD, professor and head, Endocrinology, Diabetes and Metabolism and leader of the Wisconsin Obesity Prevention Initiative (OPI).
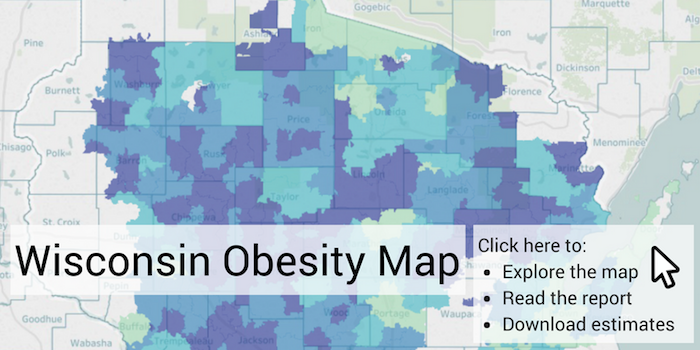
A map of Wisconsin’s “obesity epidemic” went live on June 5, 2018 at the Wisconsin Health Atlas website, allowing people to search by ZIP Code to see how their neighborhood compares to others.
“The big picture of the obesity epidemic in Wisconsin is quite disconcerting: obesity is even more common than we thought based on self-reported information,’’ said Cryns, who researches how obesity leads to other diseases like cancer and diabetes.
Overall, 41 percent of adults and 15 percent of children in Wisconsin are obese, a rate that makes Wisconsin about average among states. But obesity rates in Wisconsin vary dramatically by age and ZIP Code.
Adult obesity rates by ZIP Code range from 15.9 percent to 67.2 percent, meaning adults living in some ZIP Codes are more than 4 times more likely to be obese than people in other ZIP Codes. In general, rural areas have higher obesity rates than urban and suburban areas. The child obesity maps mirror the adult maps, showing that where obesity is a problem for adults, children are also more likely to be obese.
“The variation is striking,” saidHilary Joyner, MS, assistant researcher, Department of Population Health Sciences, who directed the map project for OPI. “The disparity in rural areas could be due to lower availability and affordability of healthy food and the fact that people drive everywhere; there aren’t nearby destinations that rural residents can easily walk to or bike to. It may not be safe to bike or walk on some rural roads, and we’ve heard that some folks are concerned how it looks to be biking or walking because people may assume you’ve lost your driver’s license.”
Dr. Cryns says the map is a first step in identifying the communities most affected by obesity where resources could be targeted to do a better job creating opportunities for health. In addition, future mapping of the obesity prevalence will allow researchers to determine if local programs and policies to support healthy weight are working.
"These maps are sobering, but without data you don’t know where to focus your efforts," said Dr. Cryns. "We need to think about ways to plan our communities so it’s easier to be physically active and eat healthy food. This map is really a resource for people, public health leaders and physicians, and a fresh approach to solving this epidemic."
Dr. Cryns, Joyner, and other members and partners of the OPI conducted an awareness campaign to publicize the release of the Wisconsin Obesity Map. The social media portion of the campaign alone reached more than 14,600 people, and news outlets ran 48 TV, radio, and print stories.National news outlets included Associated Press and US News and World Report, as well as local coverage by Wisconsin State Journal, Wisconsin Public Radio, and WISC-TV.
Dr. Cryns served as spokesperson for a Facebook Live video discussion shown below, which has been viewed more than 6,100 times on the UW Health Facebook page.
A social media campaign through healthTIDE (a social media presence for the OPI effort) reached 10,203 individuals. In combination with an e-mail campaign to healthTIDE partners around the state, the Wisconsin Health Atlas website was viewed by 7,096 unique users during the publicity campaign.
Additionally, communications specialist Robert Fontella, Joyner, and other team members created an explanatory video to help public health experts, researchers, clinicians, and members of the general public understand how the Obesity Map data is designed to inform public health efforts.
"We're seeing this as a community resource so we made it accessible for everyone, so that health care providers and community members can use this information as they're working on health improvement and obesity prevention in their local area," said Joyner.
Resources:
- Wisconsin Health Atlas
- "Rural residents more likely to be obese; Madison neighborhood deemed least obese," Wisconsin State Journal, June 5, 2018
- "Study: Obesity rate increases in Wisconsin," Associated Press, June 9, 2018
- "Wisconsin Obesity Rate Higher than Previous Estimates," US News and World Report, June 11, 2018 s
- "Clinical study shows Wisconsin obesity rates are higher than self-reported," WEAU, June 9, 2018
- "New Interactive Map Reveals Clearer Picture Of Obesity In Wisconsin," Wisconsin Public Radio morning show, June 6, 2018
- "New UW Obesity Estimate Shows State Is Significantly Heavier Than Previously Thought," Wisconsin Public Radio, June 5, 2018
- "UW study looks at obesity rates in different zip codes," WISC-TV, June 6, 2018
- "Researchers create searchable map of obesity rates in Wisconsin by ZIP codes," WMTV NBC 15, June 5, 2018
- "Wisconsin Health Atlas releases obesity map," WXOW La Crosse,
- "Wisconsin researchers look at obesity in new way -- by using ZIP codes," WKBT-TV, June 10, 2018
- "Wisconsin’s Obesity Map: the ZIP Codes Weigh In," UW SMPH, June 5, 2018
- "Fast Facts: Obesity in Wisconsin," Wisconsin Public Television, June 8, 2018
- "Diagnosing the Gaps in Wisconsin's Obesity Map," WisContext, July 5, 2018